
Down, Down, and Down
The Japanese Yen is ailing...badly

In a recent post, I noted how the U.S. 10 Year Treasury Notes deserved attention.
Yields are now over 4.5% and nudging higher. This is a knock-on effect of the conflict with Iran that in itself will not go away cleanly and is now in danger of speading to Yemen.
These rising yields are also signalling that issues like a $1.15 Trillion defense spending budget for fiscal 2027 are not being well received by financial institutions.
I suggested that the situation in Japan could have a further impact on U.S. yields. The Japanese Yen is a sick currency. Right now, if a U.S. tourist went to Japan, a mere 61 American pennies would buy 1 Japanese Yen. The Japanese government would like to intervene to prop up the currency. The money to orchstrate such an intervention would come from selling some more of Japan’s U.S. government debt holdings. This would place further downward pressure on instruments like the 10-Year Notes which in turn would pressure yields higher. Not exactly what Treasury secretary Scott Bessant wants right now.
Let’s take a more in-depth look at the Yen. It moves in price cycles as determined by application of the Periodogram algorithm. Other planetary techniques can then be applied to the chart to determine coming price inflection points.
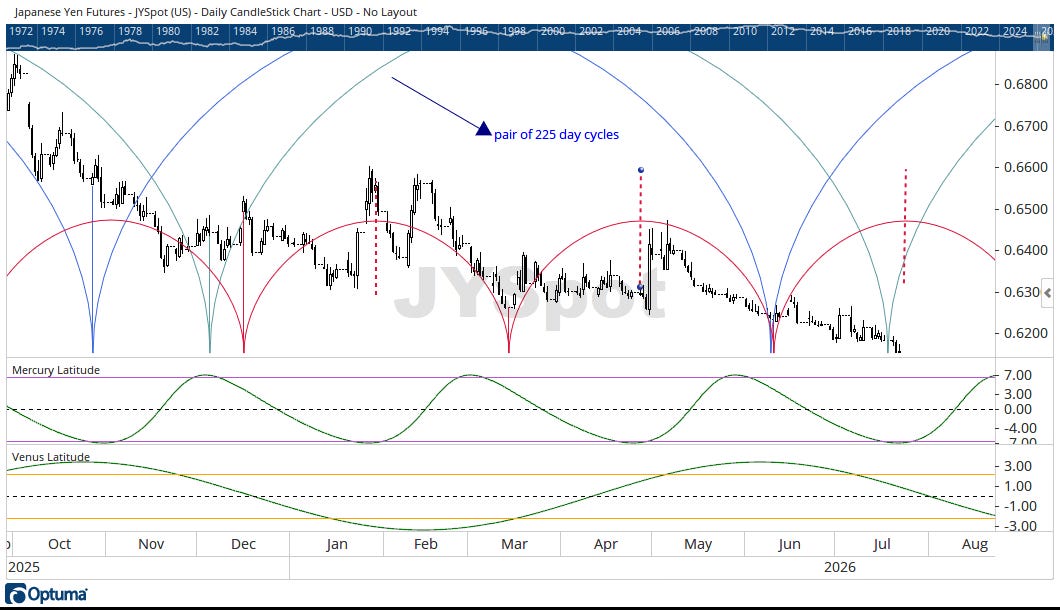
The Japanese Yen moves in accordance with a pair of offsetting 225-day cycles. There is also an 88-day cycle at work as well.
Look at the above chart closely and you will note that there are small price pivots/responses at the endpoints of the 225-day cycles. The price responses to end points of the 88-day cycles are slightly more pronounced. Through it all, the Yen just keeps grinding lower.
W.D. Gann was a proponent of identifying the heliocentric latitude of Mercury and Venus at the IPO date/first trade date of a stock or commodity. He felt that these natal latitude levels should be watched into the future.
The above chart has been fitted with plots of Mercury latitude and Venus latitude.
**Note - if you take the midpoint/equator of the Sun and project it into space in all directions, you will have created what mathematicians call a plane. Astronomers call this the ecliptic plane. As Mercury and Venus orbit the Sun, they do so in their own unique planes of motion. The separation of these planets (and their planes) from the ecliptic plane is reflected in the latitude plots on the above chart.**
Japanese Yen futures started trading May 16, 1972. On that day, Mercury was at 6.5 degrees (nearly its latitude maximum), Venus was at 2.18 degrees latitude. Following Gann’s thinking, one should be watching events of Mercury passing through 6.5 degrees and minus 6.5 degrees latitude. Likewise, one should watch Venus passing +/- 2.18 degrees latitude.
Here and now, Mercury is passing through -6.50 degrees latitude. This is a critical time for the Yen. If there is to be an intervention (in collaboration with the U.S. Treasury Dept) it could come any day.
Late August will see Venus passing -2.18 degrees latitude and Mercury passing +6.50 degrees latitude. This will be the next window of possible intervention. A projection of Venus (time by planetary degrees) from the May 6 pivot point suggests that August 24 could be a key date to focus on.
This is why it is important to focus on planetary movements. The time intervals that can be determined are valuable data points that other traders and investors do not have.
Cheers!