
Gold...
Ready for a Move Higher?

Fibonacci price retracements are critical for traders and investors to follow. In my 2026 Financial Astrology Almanac I describe how the distribution ratios of the planets in our solar system align to the Fibonacci sequence (1,1,2,3,5,8,13, etc…). This lends credence to the expression “as above so below”.
Fibonacci ratios are calculated based on the formula: 1/(sq root 1.618)^n. In this expression, ^n denotes “raised to the power”.
For example, the square root of 1.618 is 1.27200. Dropping this into the formula and letting n equal 4 gives us 1/(1.27200)^4 = 0.382. Or, in other words, the 38.2% Fibonacci retracement.
Repeating this exercise using n=1, 2, and 3 will give you three more Fibonacci ratios.
Here and now, if one looks at the price run-up in Gold from October 2022 to late January 2026 and applies the Fibonacci ratios, one sees that Gold has retraced 38.2% of this run-up.
The good news in all of this - retracements of 38.2% mean that the prevailing trend is still intact!
Normally Gold prices function according to the “real yield”. For example, the yield on 2-Year Treasury Notes is 4.67%. Subtract the rate of inflation of 3.5% and the real yield is +1.17%.
Normally a positive real yield would be a bad thing for Gold prices. However, these are not normal times we live in. Central Banks around the world have been quietly accumulating physical Gold. The geopolitical situation with Russia/Ukraine and now U.S/Iran is not good. This all explains the move higher in Gold from 2022 to 2026. Gold hitting $5400 in early 2026 was obviously a situation gone too far. Gold had gotten ahead of itself and over the end of its skis. A retracement was overdue. The fact that price has only retraced 38.2% is actually a good thing.
If you are looking for a good read on the subject of Gold, take a look at a 2009 classic: Goldbug by author James Dines. I picked up a signed copy from Mr. Dines years ago at a conference in New York when I was running with the mineral exploration crowd. Mr. Dines passed away in 2022 at the age of 91 years.
After reading this book, you will likely make haste to add some gold mining shares to your portfolio as protection against the financial shitstorm that is building on the horizon.

Let’s now dig deeper into Gold price using planetary cycles and other techniques such as Bayer’s Rules, the Square of Nine, and also squaring of price with time…
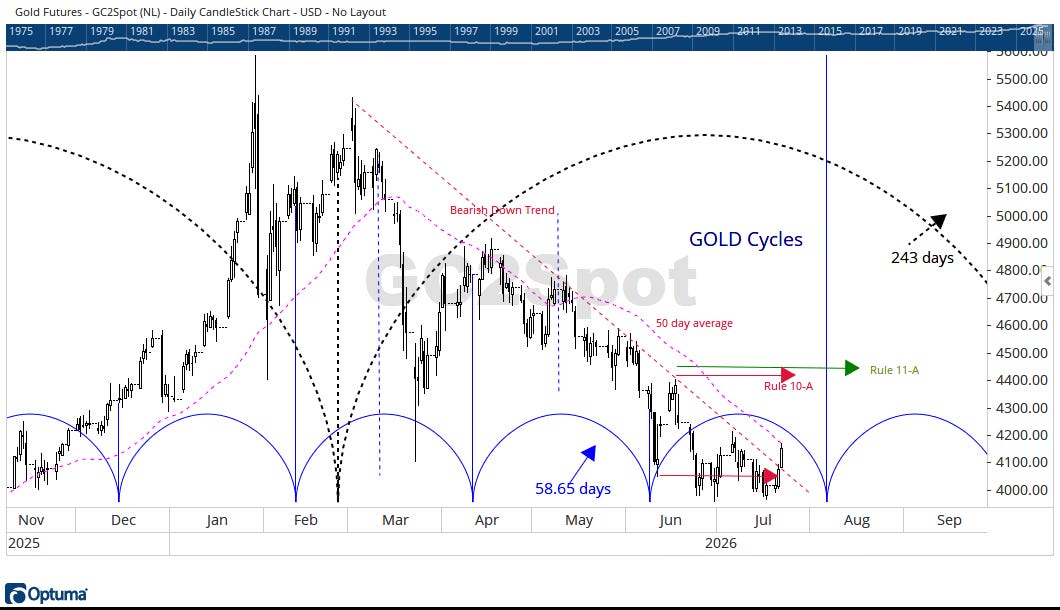
Gold functions on a longer 243-day cycle (the Venus orbital period around the Sun). There is a shorter cycle of 58.65-days as well (Mercury axial spin time).
The above chart shows that indeed Gold price has been in a bearish downtrend for several months now.
From the late January high, if one applies Gann’s Square of Nine technique, there should have been a price support level at $3936. It turns out that the intra-day low on July 1, 2026 was $3955.
From that same January high, if one makes Venus degree projections into the futures, the date of June 28 lands at one of these intervals. Mercury degree advances shows July 3 to be a key date.
This is a squaring of price and time.
From the price pivot point on June 16-17, a Bayer’s Rule 10-A projection points to yesterday and today (July 22-23). Yesterday Gold was up sharply. Today, down sharply. A Mars projection from late January points to July 30.
A Rule 11-A projection points to August 14 which is just after the end of the current 88-day cycle.
Keep these dates in mind. Also watch the simple 50-day moving average. If Gold can get above and stay above this average, we can look for a significant move higher.
This is the time to start looking at gold mining stocks. My suggestion is to stick with those that are producing. Avoid the ones that are just telling stories about how big their mine will be if they ever have one….
Cheers!