
NVDA Sags...
The planets said it would....

In a post to paid subscribers earlier this week, I pointed to May 20 when Nvidia (NVDA) would release its Q1 earnings.
Leading into the earnings release there was lots of chatter about how the Options market was portending a 6% rise in NVDA share price.
Earnings were quite good, but it seems to have been a case of buy the rumor, sell the news.
No surprise on my part. I was watching the NVDA earnings release knowing that there were some planetary factors lurking in the background.
NVDA made its IPO on January 22, 1999. Heliocentric Venus at that date was at 350 degrees and heliocentric Mars was at 172 degrees.
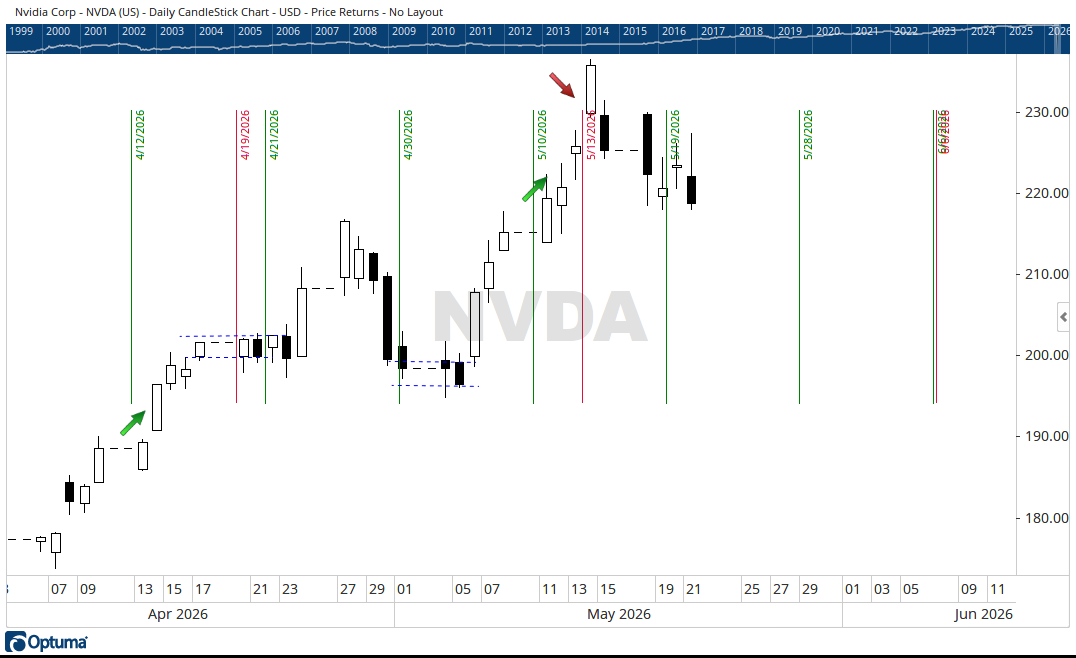
The chart segment below has been fitted with the 15 degree intervals of Venus and Mars starting from the 1999 IPO date. May 13 marked a Mars increment. And look what NVDA did on that date - it peaked at $236.54. May 19 marked a Venus increment. Share price tried to rally, but the short term trend had changed already on May 13. Today, as I type this post, price is weaker yet.
In a previous post I wrote about determining the heliocentric latitude of Mercury and Venus at a stock’s IPO date. W.D. Gann was a proponent of using latitude (and declination). Let’s say at an IPO date Mercury is a 2.XX degrees latitude and Venus is at 1.ZZ degrees. Into the future, when the latitude of Mercury is either +2.XX degrees or -2.XX degrees, the chances of a price reaction are very good. Into the future, when the latitude of Venus is either +1.ZZ degrees or -1.ZZ degrees, the chances of a price reaction are very good.Also, when Mercury or Venus passes latitude maxima or minima levels, there will likely be a price reaction.
Somehow, someway, the human animal is hard-wired to changes in planetary latitude.
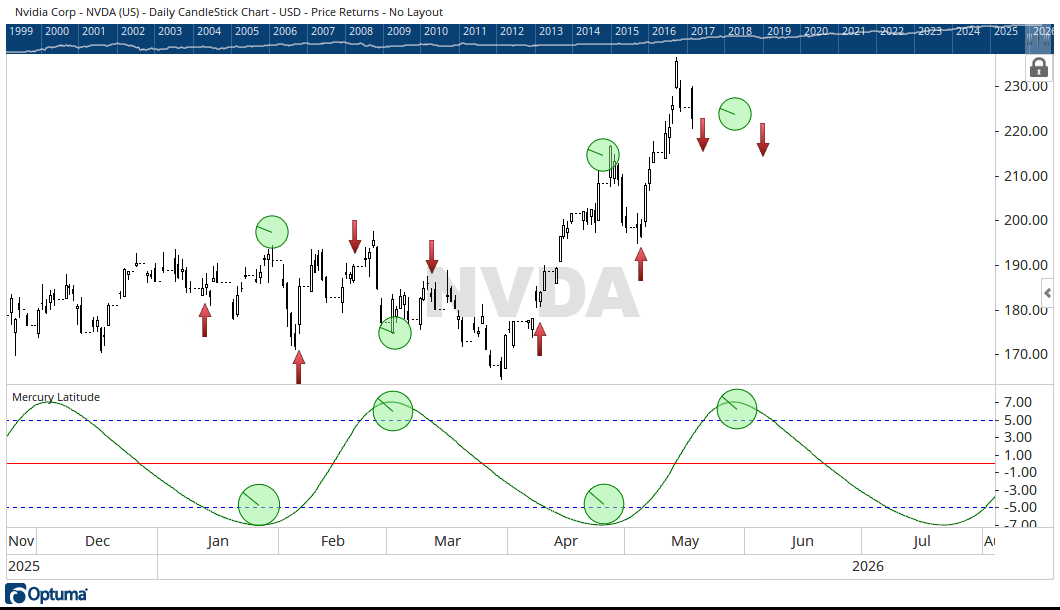
The above chart segment has been annotated with red arrows to depict times when Mercury passed through both the plus and minus levels of the same latitude as at the NVDA IPO back in 1999. The green circles denote Mercury’s maximum and miniumum latitude.
Wednesday May 20 (NVDA earnings day) Mercury passed through one of key latitude levels. Towards the end of May, Mercury will be at its latitude maxima.
Now, let’s look at the latitude of Venus…
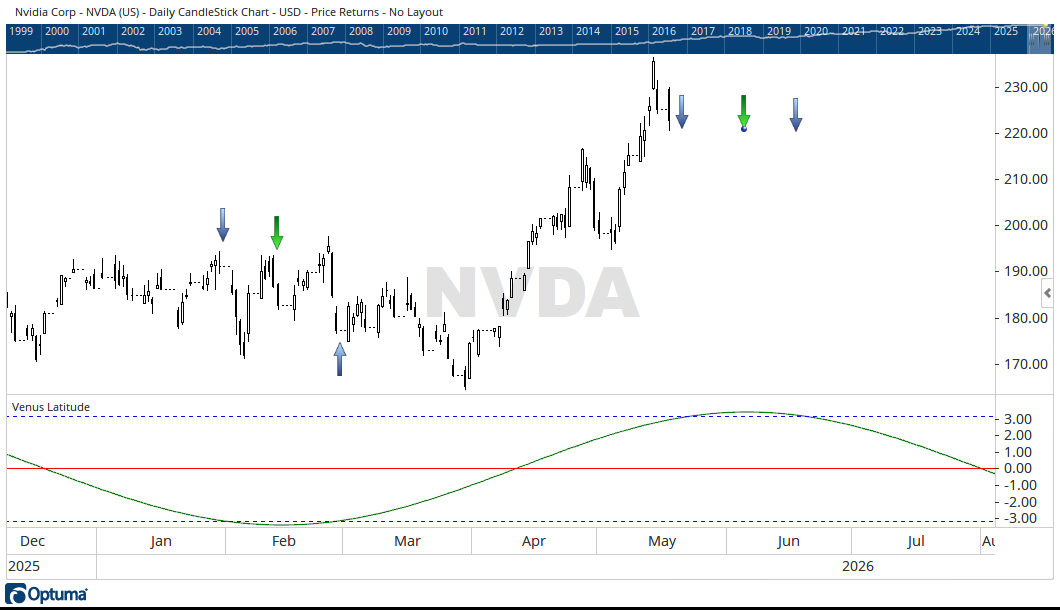
The above chart segment has been annotated with blue arrows to depict times when Venus passed through both the plus and minus levels of its IPO latitude. The green arrows denote Venus’ maximum and miniumum latitude.
Wednesday May 20 had Venus passing through through one of key latitude levels. Around June 4, Venus will be at its latitude maxima.
So there you have it….NVDA earnings were received by the market. The market has shrugged its shoulders at the news. Mercury, Venus, and Mars rule the day - not the Options market and the Black Scholes model.
This book - Astrology Really Works, which I found at a used bookstore years ago discusses the use of latitude (and declination). This technique worked in 1985 when the book was written. This technique works today….
Planetary Trader is designed to raise investor awareness of how planetary movements in our cosmos affect our emotions and thereby the financial markets. This particular post is free for all to read. To receive new posts similar to this one on a frequent basis that free viewers do not always see, consider becoming a paid subscriber. The monthly cost can be measured in about two cups of coffee at your local fancy coffeeshop.