
Quantum Physics and the Financial Markets
The falling US Dollar..

In my published material, I often refer to the connection between a stock price chart and quantum physics. This is not my original thinking - far from it. This notion was first read about 14 years ago when I came upon the material of Fabio Oreste.
As Oreste explains - in physics, an atomic orbital is a mathematical function that describes the wavelike behavior of either one electron or a pair of electrons in an atom. You likely learned of this stuff in first year chemistry at college or university. Remember the p and n orbital shells the professor talked about?
Atomic orbitals are the possible quantum states of an electron as it whizzes around an atom. Oreste suggests that traders and investors ought to think of quantum lines as if they were atomic orbitals to better understand the behavior of stock prices.
In the 1700s, Isaac Newton (remember him from high school physics?) said that all celestial bodies in the cosmos are attracted to each other (his Universal Law of Gravitational Attraction). This attraction keeps the planets in the solar system fixed in their orbits so they do not float away. He said the Universe was a perfect mathematical place where everything behaved in a precise and predictable way.
In the early 1900s, Albert Einstein (we also learned about him in physics class) expanded on (somewhat challenged) the Newtonian way of thinking. In Einstein’s Theory of General Relativity, he said that a planet’s mass is a form of energy that when combined with gravity has the capacity to curve space. Wow! My brain aches just thinking about space-time as a fabric that can be curved by a planet orbiting through it.
If space-time fabric bends, then so too must light experience some bending. Now we have to back up just a bit into the mid-1800s and a scientist/mathematician called Bernard Reiman. He said if the fabric bends, then mathematics of curvature can be used to describe everything.
Applying Riemann’s ideas of curvature - picture the price of a stock as being a ball in constant motion on a rugged terrain full of cavities and bumps. At times the ball ascends a bump, which is like a stock price in an uptrend. When the ball reaches the peak of the bump, this is like the price of the stock making a high on a price chart. Once the stock makes a peak, it begins to descend, sliding down toward a low cavity on the surface. This is like a price downtrend. Then the stock might roll on a flat portion of the terrain which is like a sideways consolidation trend.
Einstein said that the greater the density of matter in a region, the higher the curvature of space-time. So a large planet like Jupiter can distort space time more and make for a Reiman terrain with more rugged terrain.
In his writings, Oreste manages to formulate an equation that allows one to calculate quantum lines for a price chart. Not easy to use, but for sure powerful. For several years I included a chapter in my annual Financial Astrology Almanac in which I talked about quantum. I think all I did was scare readers with this heavy-duty stuff.
When one uses Oreste’s equation to calculate quantum lines, all too often one will see price action moving in parallel to a quantum line. Then price might decide to move to a higher quantum line. Traders need to keep a close eye on how price each day is aligning to the nearest quantum line. However, don’t throw all your chart technical indicators overboard. You can use them to confirm changes in trend as price interacts with various quantum lines.
The following is a segment of the US Dollar Index with Jupiter quantum lines overlaid in green color. The quantum lines can be divided into smaller harmonics is so desired (blue dashed lines and pink dashed lines). Note how price in many cases tightly interacts with these various quanta… I have annotated the chart with some green arrows to illustrate this point.
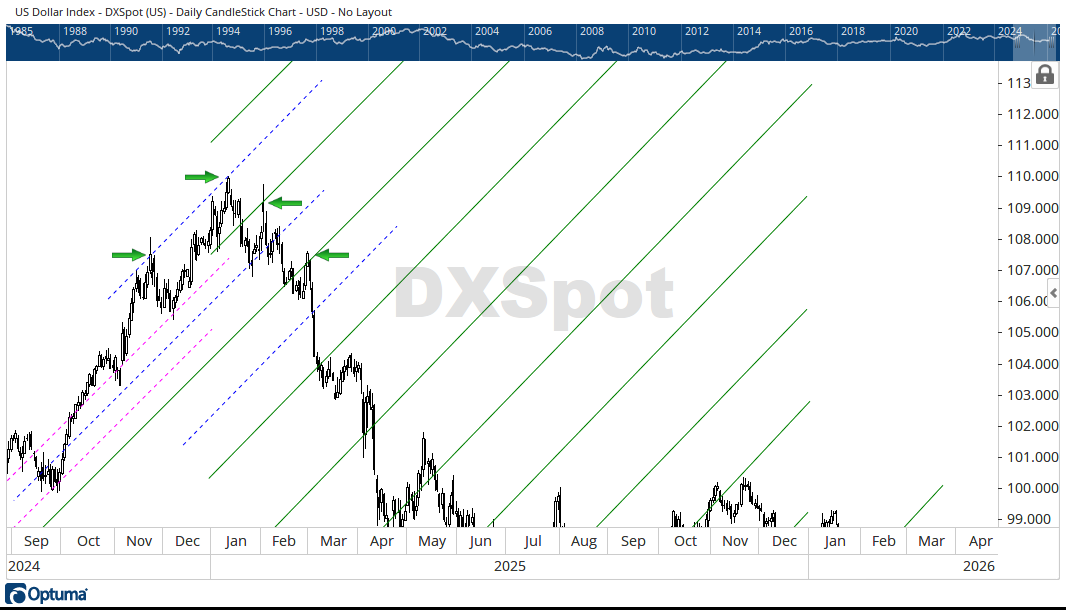
US Dollar Index
This chart looks rather nasty. Some would say it looks ugly. I see some serious problems brewing. Remarks by the U.S. Administration in the past day or so certainly have not helped.
Remember - those U.S. bills in your wallet were backed by something (Gold bullion at the New York Federal Reserve Bank) up until 1971 when Pres. Nixon severed the convertibility. Since 1971, the Dollar has been a fiat currency backed by nothing.
Now, thanks to technological advances (blockchain and digital crypto currencies), a return is being made to the idea of “backing” again.
But this time it will not be the Dollar that gets backed. The massive debt of the U.S. (measured in trillions of dollars) is about to be monetized by linking it - not to the Dollar - but to a new creation.
Did you hear of the GENIUS Act, signed into law in July 2025? It allows for the creation and distribution of Stable Coins.
Stable Coins will soon be a reality in the economy where a Stable Coin is backed by U.S. Treasury debt. There is lots of debt out there so there will be lots of Stable Coins created. In fact, these Stable Coins could become a new form of Reserve Currency. The present Reserve Currency - the fiat paper dollar - might be left to perish….
But all of this will become clearer in the next few months….
Now, lets take a closer look at the US Dollar here and now.
