
The Japanese Yen
Through the Quantum Looking Glass

In my published material, I often refer to the connection between a stock price chart and quantum physics. This is not my original thinking - far from it. This notion was first read about 14 years ago when I came upon the material of Fabio Oreste.
As Oreste explains - in physics, an atomic orbital is a mathematical function that describes the wavelike behavior of either one electron or a pair of electrons in an atom. You likely learned of this stuff in first year chemistry at college or university. Remember the p and n orbital shells the professor talked about?
Atomic orbitals are the possible quantum states of an electron as it whizzes around an atom. Oreste suggests that traders and investors ought to think of quantum lines as if they were atomic orbitals to better understand the behavior of stock prices.
In the 1700s, Isaac Newton (remember him from high school physics?) said that all celestial bodies in the cosmos are attracted to each other (his Universal Law of Gravitational Attraction). This attraction keeps the planets in the solar system fixed in their orbits so they do not float away. He said the Universe was a perfect mathematical place where everything behaved in a precise and predictable way.
In the early 1900s, Albert Einstein (we also learned about him in physics class) expanded on (somewhat challenged) the Newtonian way of thinking. In Einstein’s Theory of General Relativity, he said that a planet’s mass is a form of energy that when combined with gravity has the capacity to curve space. Wow! My brain aches just thinking about space-time as a fabric that can be curved by a planet orbiting through it.
If space-time fabric bends, then so too must light experience some bending. Now we have to back up just a bit into the mid-1800s and a scientist/mathematician called Bernard Reiman. He said if the fabric bends, then mathematics of curvature can be used to describe everything.
Applying Riemann’s ideas of curvature - picture the price of a stock as being a ball in constant motion on a rugged terrain full of cavities and bumps. At times the ball ascends a bump, which is like a stock price in an uptrend. When the ball reaches the peak of the bump, this is like the price of the stock making a high on a price chart. Once the stock makes a peak, it begins to descend, sliding down toward a low cavity on the surface. This is like a price downtrend. Then the stock might roll on a flat portion of the terrain which is like a sideways consolidation trend.
Einstein said that the greater the density of matter in a region, the higher the curvature of space-time. So a large planet like Jupiter can distort space time more and make for a Reiman terrain with more rugged terrain.
In his writings, Oreste manages to formulate an equation that allows one to calculate quantum lines for a price chart. Not easy to use, but for sure powerful. For several years I included a chapter in my annual Financial Astrology Almanac in which I talked about quantum. I think all I did was scare readers with this heavy-duty stuff.
When one uses Oreste’s equation to calculate quantum lines, all too often one will see price action moving in parallel to a quantum line. Then price might decide to move to a higher quantum line. Traders need to keep a close eye on how price each day is aligning to the nearest quantum line. However, don’t throw all your chart technical indicators overboard. You can use them to confirm changes in trend as price interacts with various quantum lines.
The following is a segment of the Japanese Yen with Jupiter quantum lines overlaid in green color. On the left part of the chart, the price trend slops down - the Yen is weakening. In March 2024, 1$US bought you 146 Yen. In July 2024, 1$US bought you 160 Yen. Note how in August 2024, an attempt at strengthening was repelled back right at a quantum line. Efforts to strengthen then generally followed the slope of the quantum lines. Until October 2024, that is. Then weakness set in and the Yen began a slide that would carry it into 2025.
You will also notice some red arcs overlaid on the chart. The Yen follows a Mercury axial spin cycle of 58.65 days. On a larger horizon, the Yen also follows a Venus 225-day cycle (blue arc).
Think of quantum lines as guard rails on either side of a roadway. To traders and investors, quantum lines can provide tremendous insight into the strength of a price trend. A powerful tool to be sure…
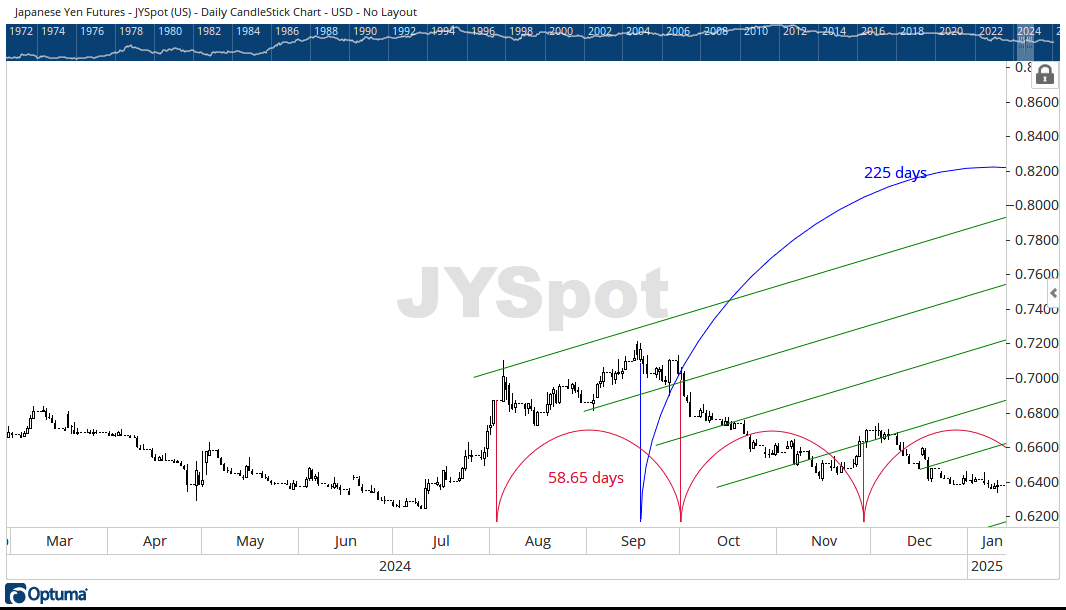
Yen (inverse of the y-axis numbers tells how many Yes can be had for $1 USD)
Now, let’s move ahead in time to here and now. The Yen is struggling and Japan is on the verge of an intervention to stabilize it. Such a move, however, can be a fool’s errand. Just ask George Sorros - who literally broke the bank of England when efforts to stabilize the Pound were not executed properly. Don’t be surprised to hear that the U.S. has helped Japan. The last thing the U.S. Treasury wants is for Japan to sell off its U.S. Treasuries to raise the money for a currency intervention…
